Page Quick Links: 2006 Ashland HEM . 2007 Firth HEM . 2009 Sprague HEM . 2013 Clarkson-Howells TDEM . 2013 Dwight-Val.-Brainard TDEM . 2007 Pilot Sites (Google Earth) . Recharge Stations
Media and Downloads
AEM Data on ENWRA Website ![]() Play Overview ( 2020 AEM Reports are available on the 2020 AEM tab)
Play Overview ( 2020 AEM Reports are available on the 2020 AEM tab)
Tutorials
AEM Data in Google Earth Tutorial Part 1![]() Play
Play
AEM Data in Google Earth Tutorial Part 2![]() Play
Play
AEM Data in Google Earth Tutorial Part 3![]() Play
Play
AEM Data in Google Earth Tutorial Part 4![]() Play
Play
AEM Data in Google Earth Tutorial Part 5![]() Play
Play
Documents
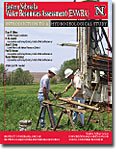 ENWRA - Introduction to a Hydrogeological Study
This publication contains detailed information about ENWRA's projects and goals, as well as a general overview of groundwater in Nebraska.
![]() Download (PDF, 6.5 MB)
Download (PDF, 6.5 MB)
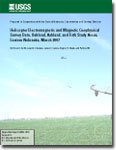 USGS Open File Report 2008-1018
This report assesses multiple geophysical techniques that were applied near Oakland, Ashland and Firth, Nebraska.
![]() Download (PDF, 1 MB)
Download (PDF, 1 MB)
 USGS Scientific Investigations Report 2011-5228
This report assesses multiple geophysical techniques that were applied near Oakland, Nebraska.
![]() Download (PDF, 14 MB)
Download (PDF, 14 MB)
 Ashland-area Helicopter Electromagnetic (HEM) Survey Report, 2006
This report contains maps and discussion of the hydrogeology in the Ashland, Nebraska area based on interpretation of HEM data collected in 2006.
![]() Download (PDF, 3 MB)
Download (PDF, 3 MB)
 Firth-area Helicopter Electromagnetic (HEM) Survey Report, 2007
This report contains maps and discussion of the hydrogeology in the Firth, Nebraska area based on interpretation of HEM data collected in 2007.
![]() Download (PDF, 8 MB)
Download (PDF, 8 MB)
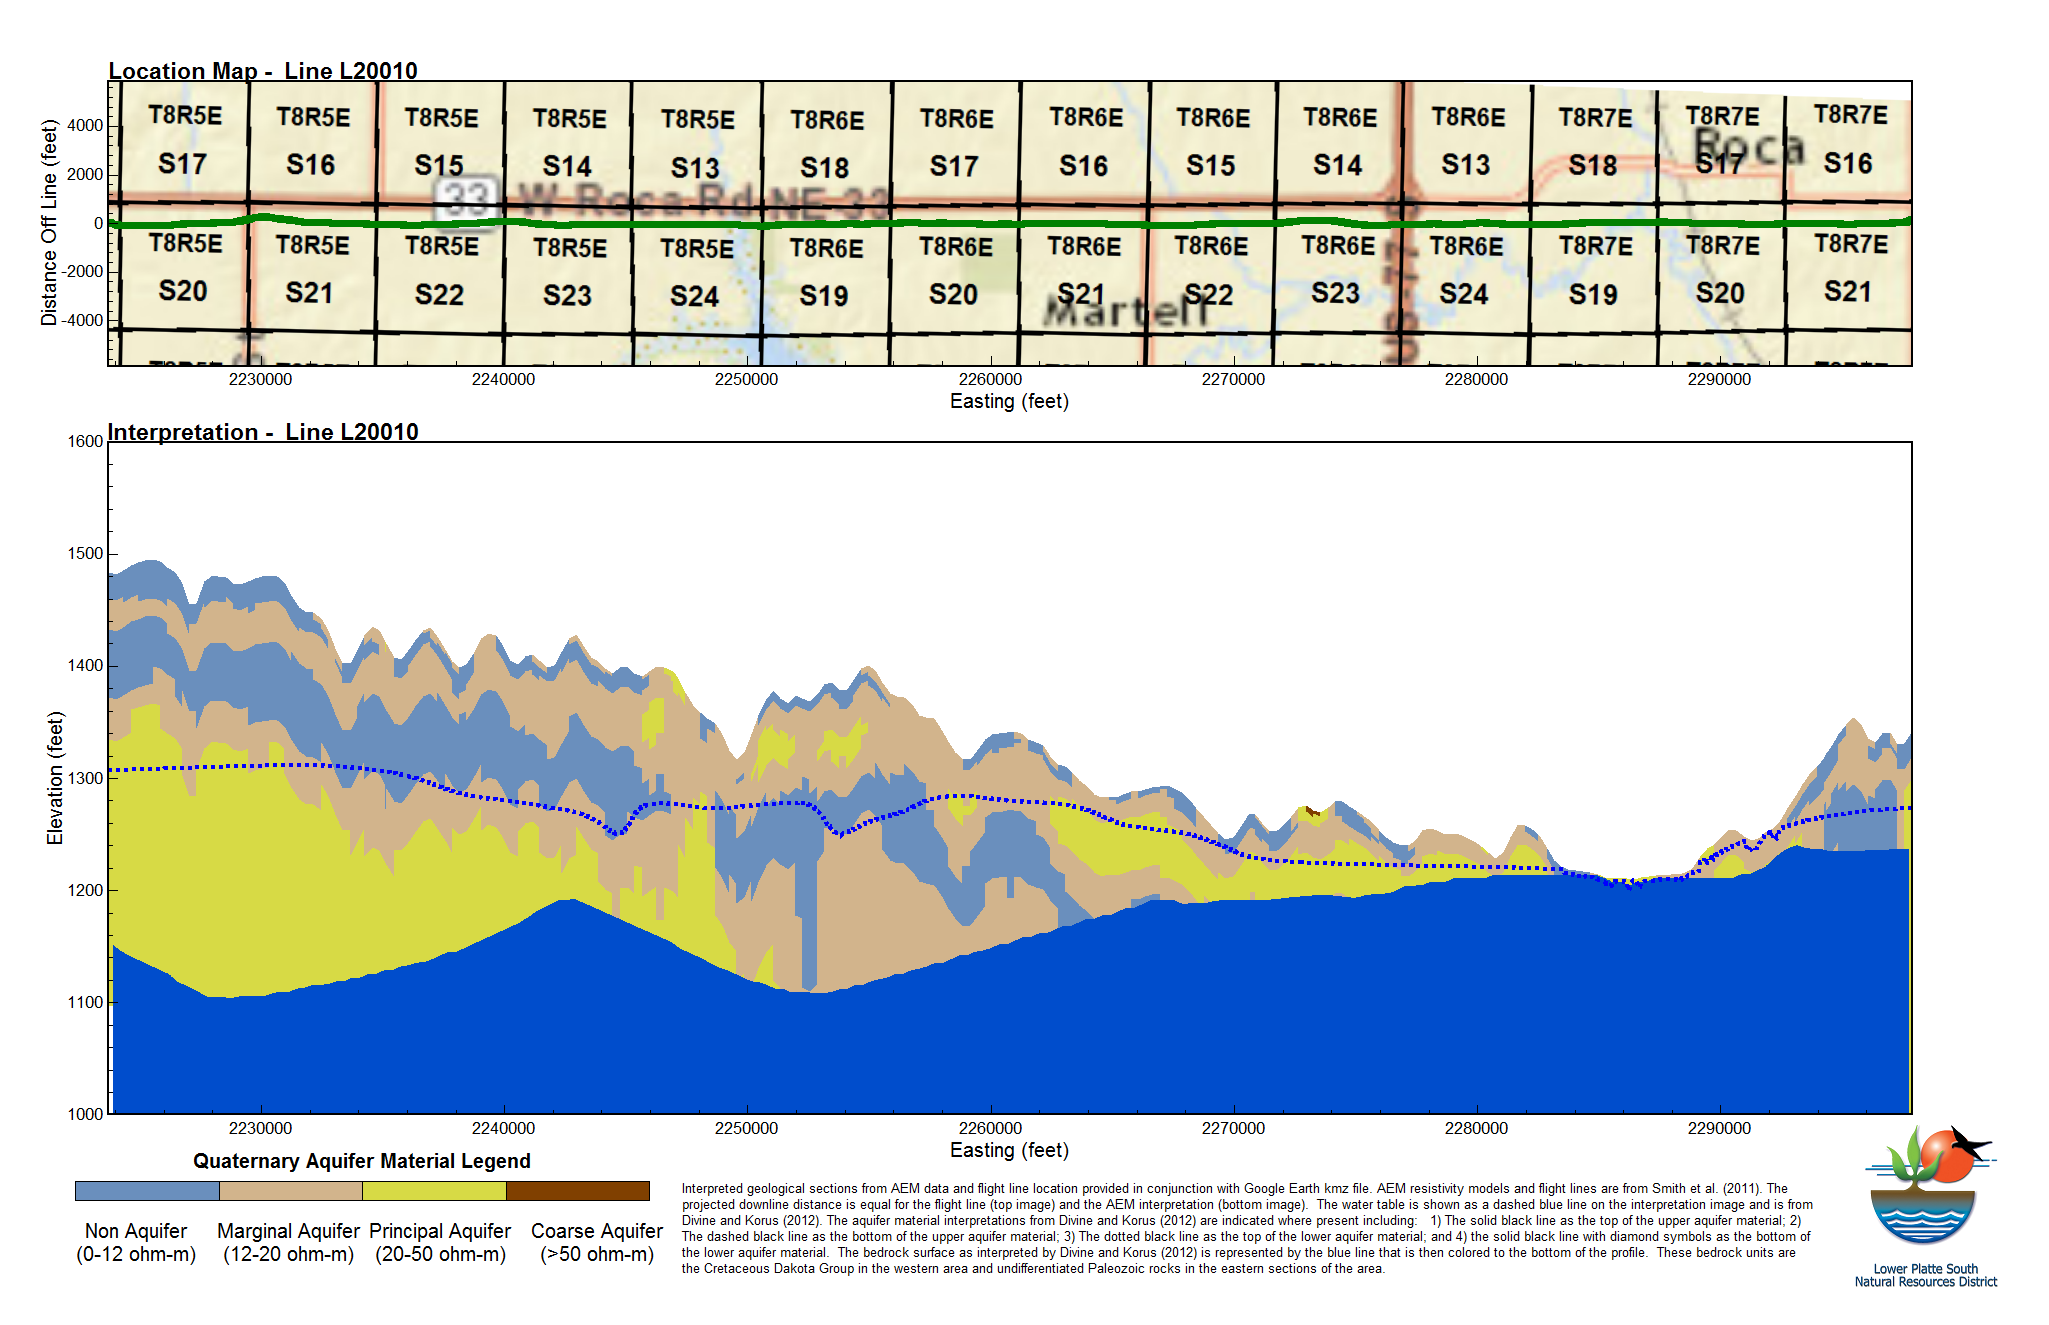
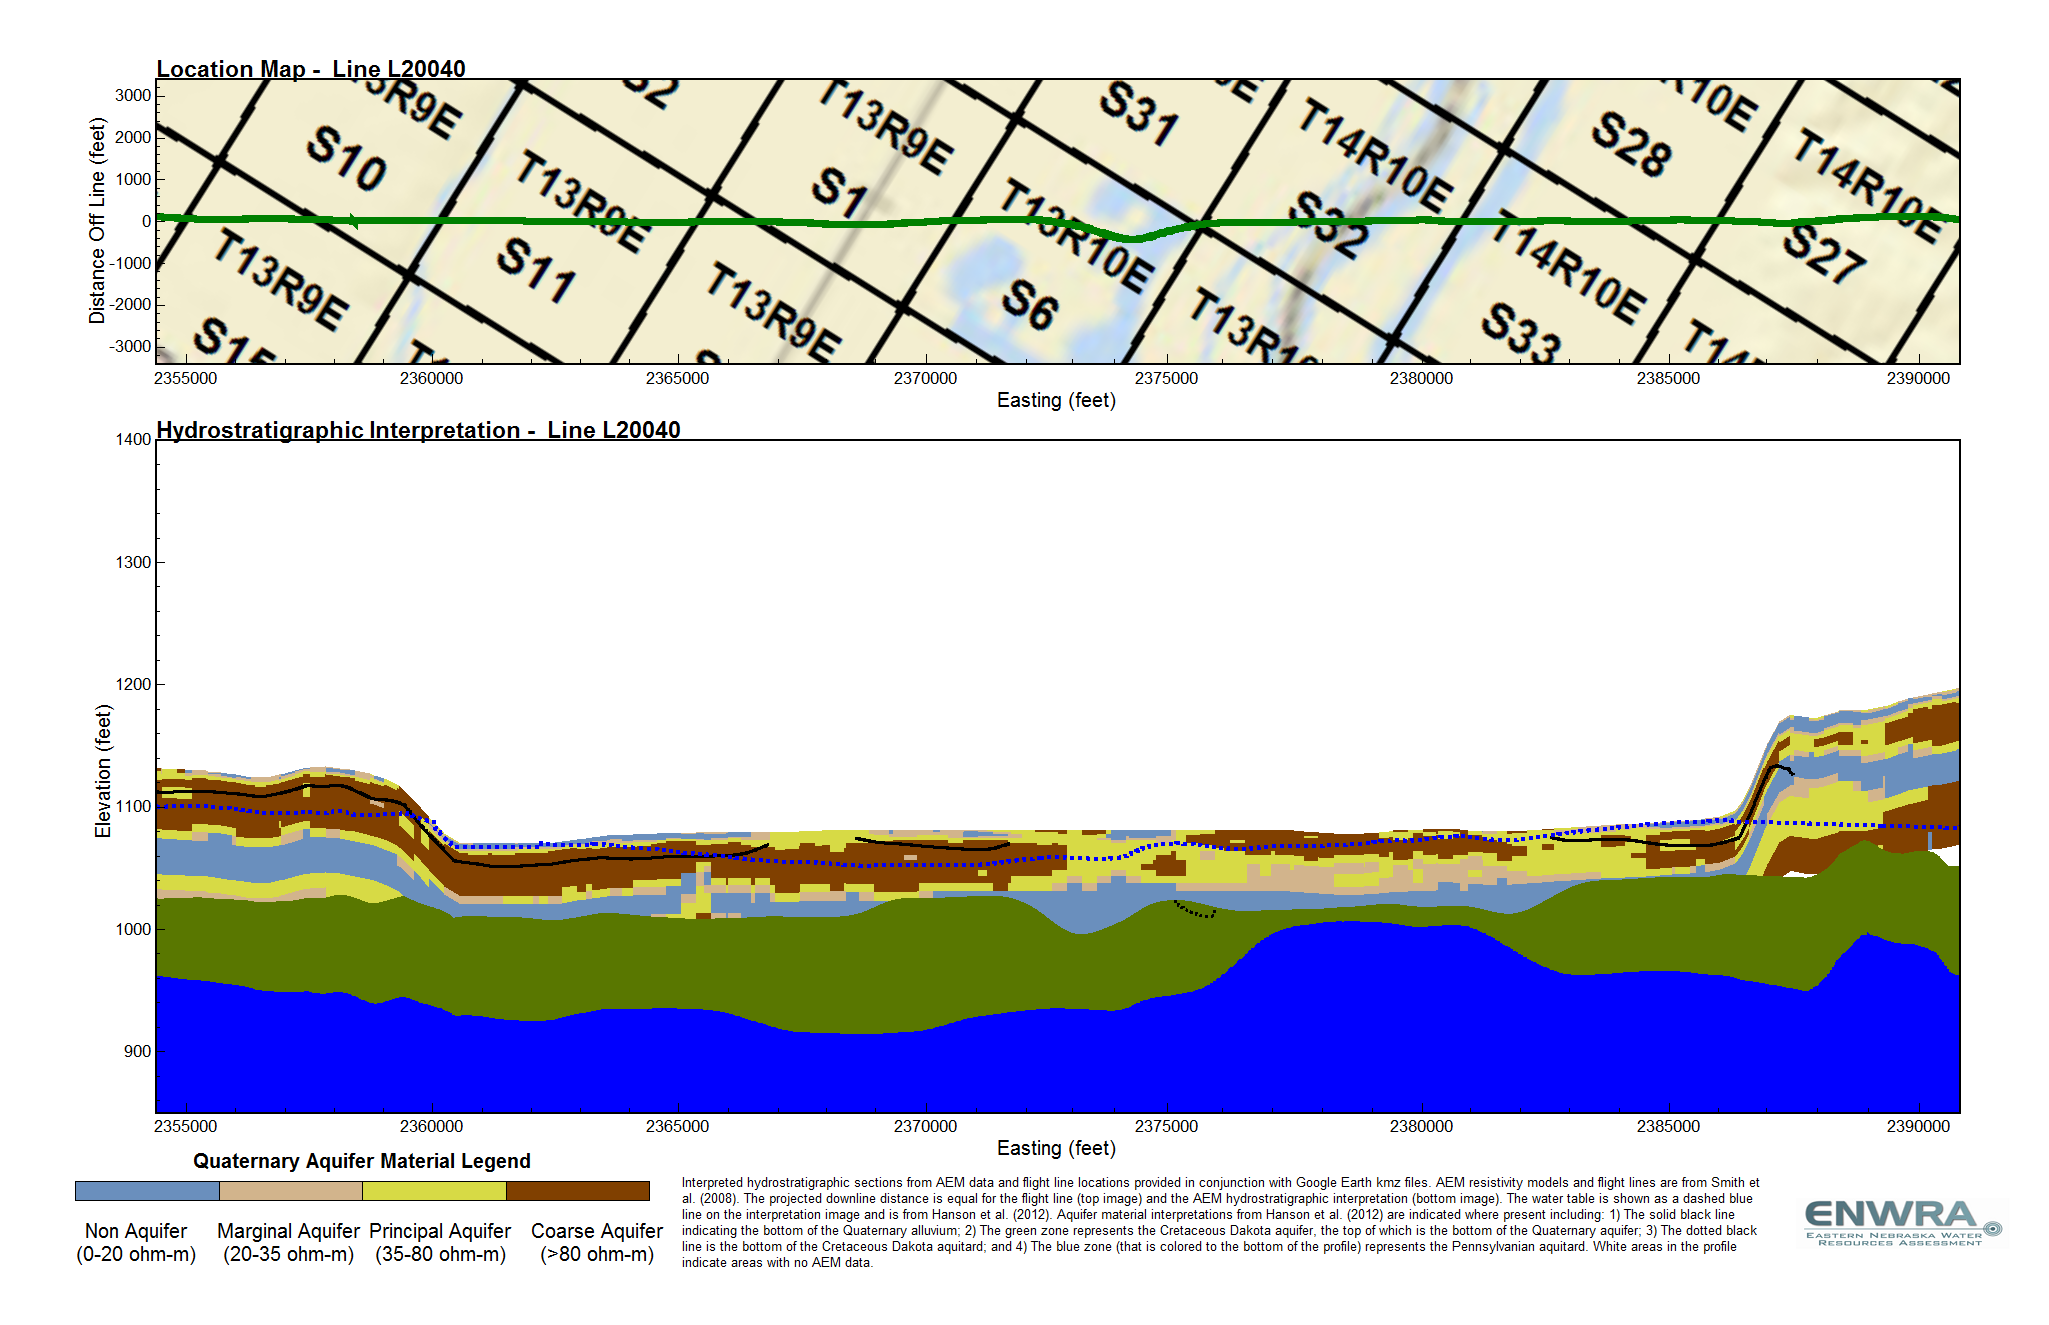
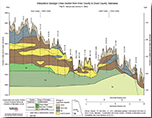 Geologic Cross Sections, Eastern Nebraska
This document presents three regional geologic cross sections and accompanying text describing the methodology used to draw the cross sections.
![]() Download (PDF, 2.6 MB)
Download (PDF, 2.6 MB)
 ENWRA Recharge Studies
These two articles summarize
recharge study data collected at
ENWRA's pilot sites.
![]() Download (PDF, 2 MB)
Download (PDF, 2 MB)
![]() Download (PDF, 2.3 MB)
Download (PDF, 2.3 MB)
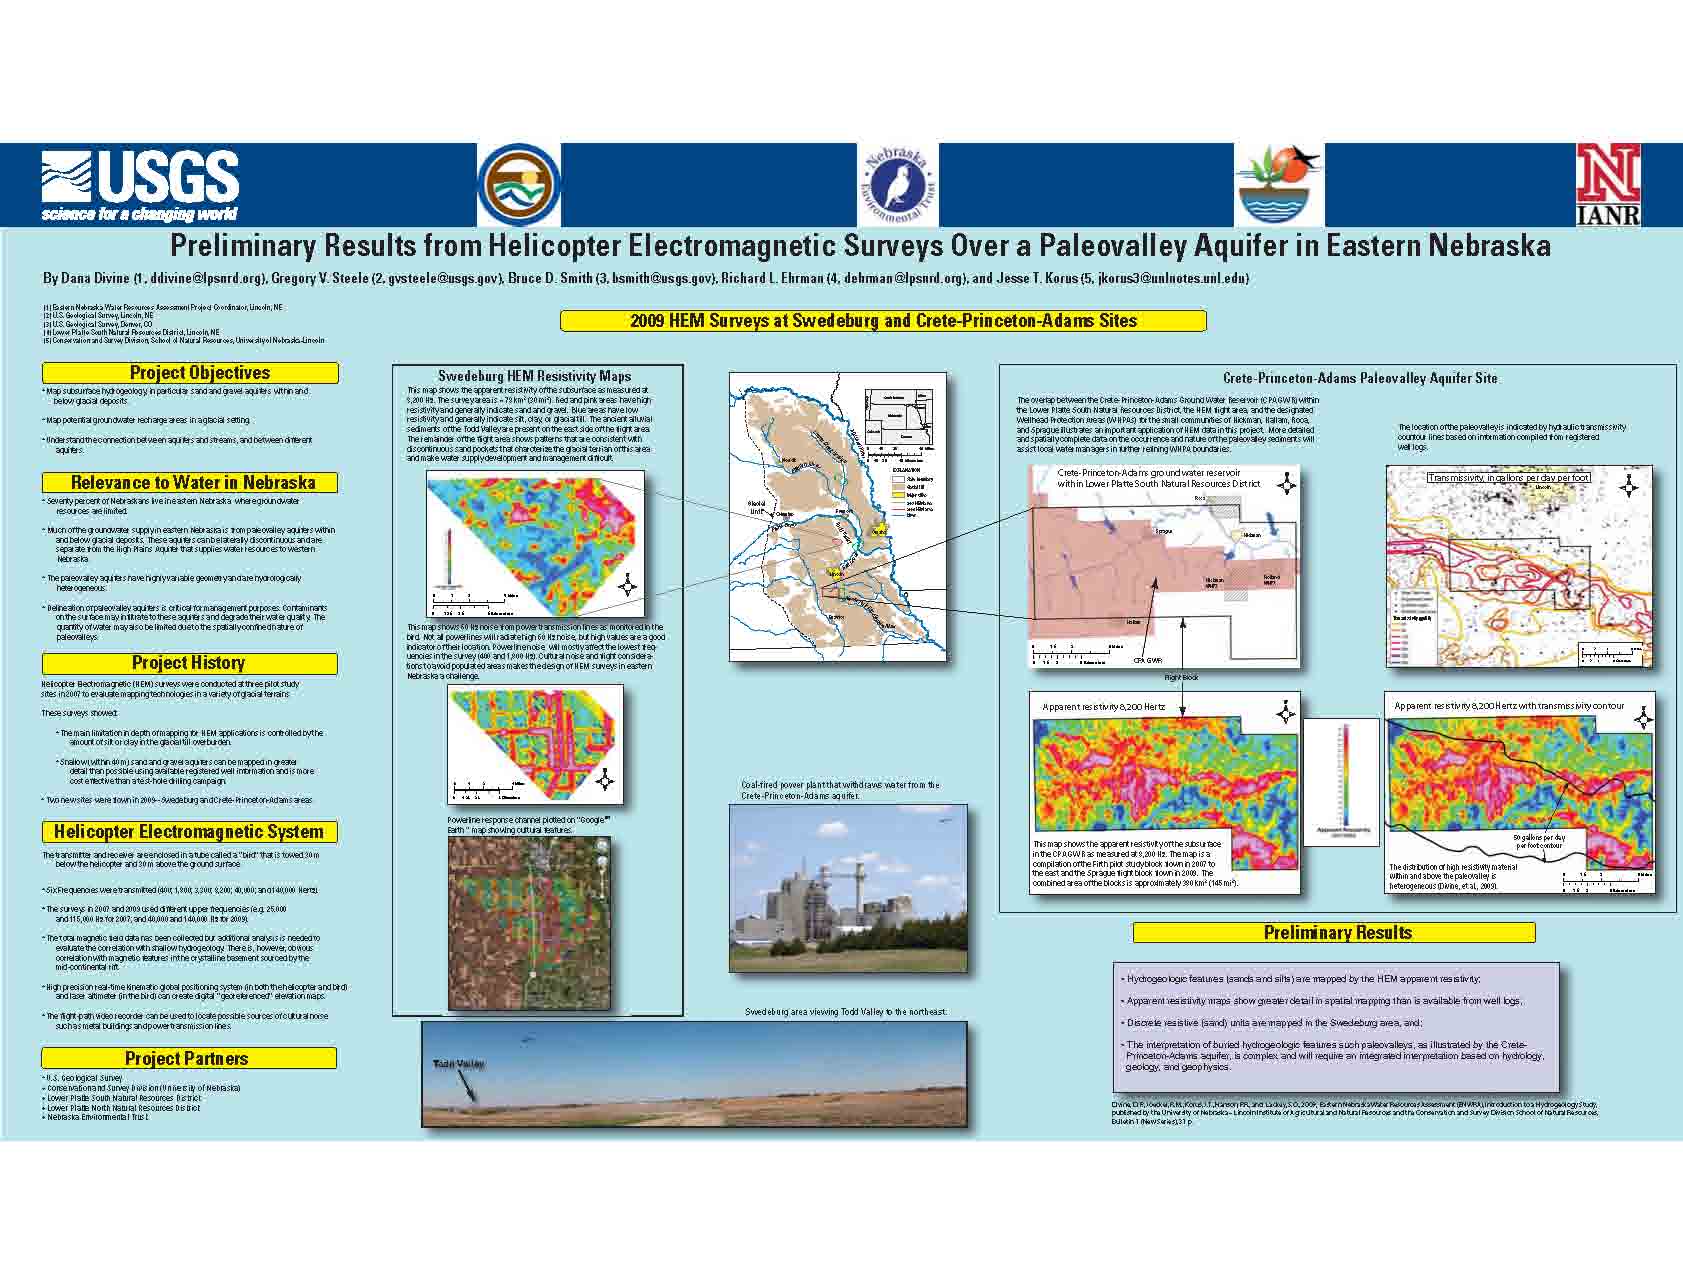 2009 HEM Poster
This poster summarizes some of the HEM data collected in 2009. The poster was presented at the 2009 Geological Society of America Annual Meeting in Portland, OR.
![]() Download (PDF, 4 MB)
Download (PDF, 4 MB)
Ashland Pilot-Scale MODFLOW Model
This model assesses the effects of changes in on-farm irrigation efficiency, land use, and irrigated acres on groundwater levels and streamflow for improved water management.
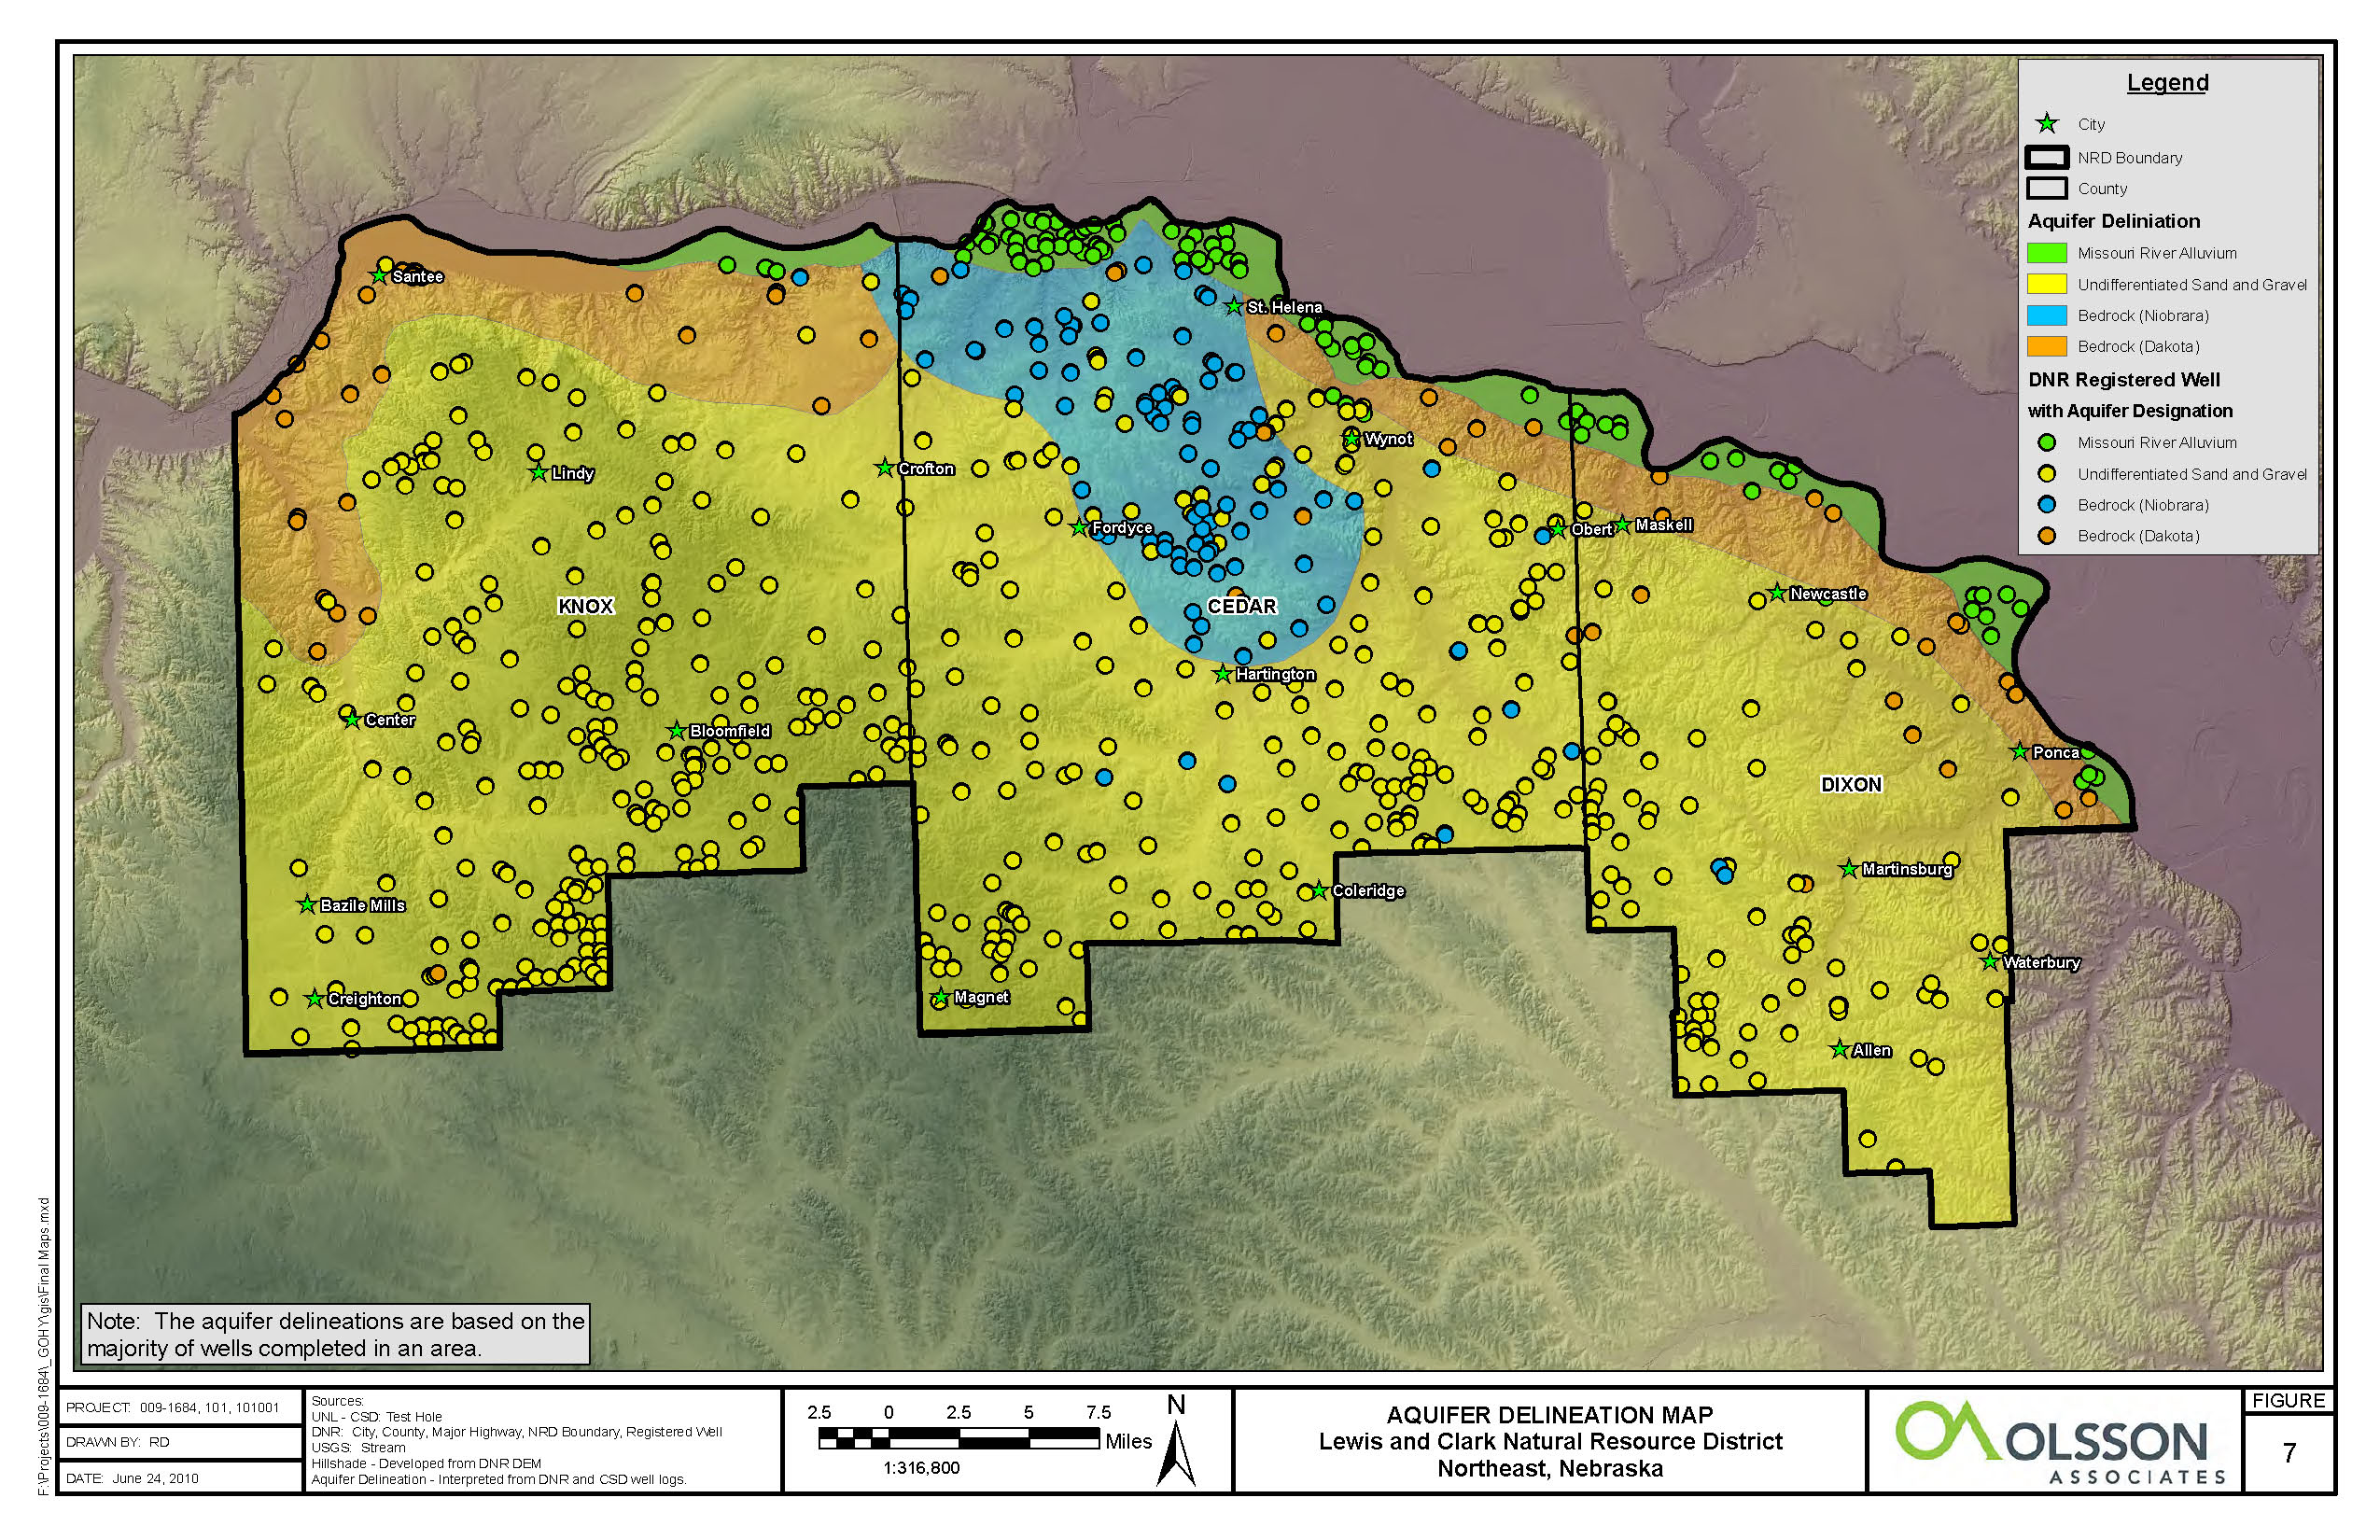 Aquifer Delineation Maps
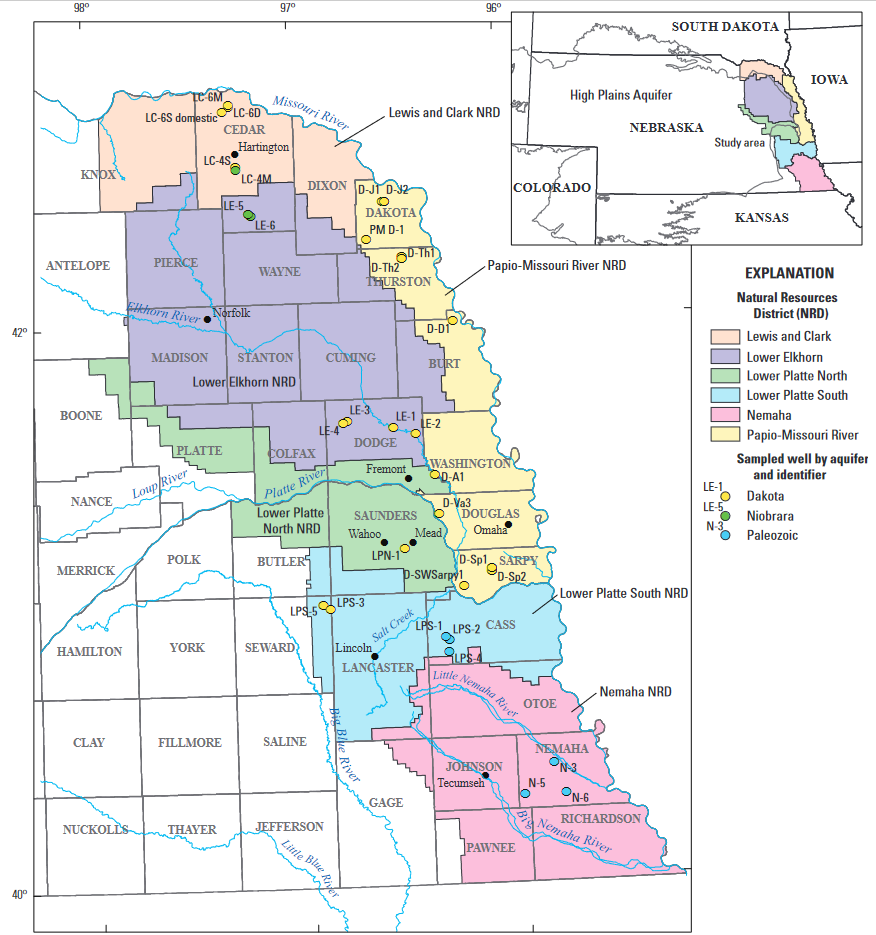
These maps show the distribution of unconsolidated sand and gravel units serving as localized aquifers at the NRD scale.
Lewis & Clark Report ![]() Download (PDF, 1 MB)
Download (PDF, 1 MB)
Lewis & Clark Figures ![]() Download (PDF, 5 MB)
Download (PDF, 5 MB)
Lower Platte North Report ![]() Download (PDF, 1 MB)
Download (PDF, 1 MB)
Lower Platte North Figures ![]() Download (PDF, 57 MB)
Download (PDF, 57 MB)
 Lower Elkhorn Report on Airborne Electromagnetic (AEM) Survey in the Clarkson/Howells area
Report on AEM flights conducted for the area between the towns of Clarkson and Howells that experienced record groundwater declines during 2012. Exploration Resources International (XRI) entered into an agreement with Lower Elkhorn to undertake the hydrogeologic study in 2013.
Clarkson Howells Report ![]() Download (PDF, 3.5 MB)
Download (PDF, 3.5 MB)
The results presented in the Clarkson-Howells Report have been provided in Google Earth format. You can download the free version of Google Earth Pro by clicking here. Once you have Google Earth installed on your computer you can download the .kmz file (656 KB) from the ENWRA Dropbox here. Dropbox is free for users. You can select "no thanks" to the sign-up for a Dropbox account and still download the files (Dropbox no longer works in internet explorer browser). If you already have a Dropbox account, please save to your computer hard drive (choose direct download) so as to not fill up space on your personal Dropbox account.
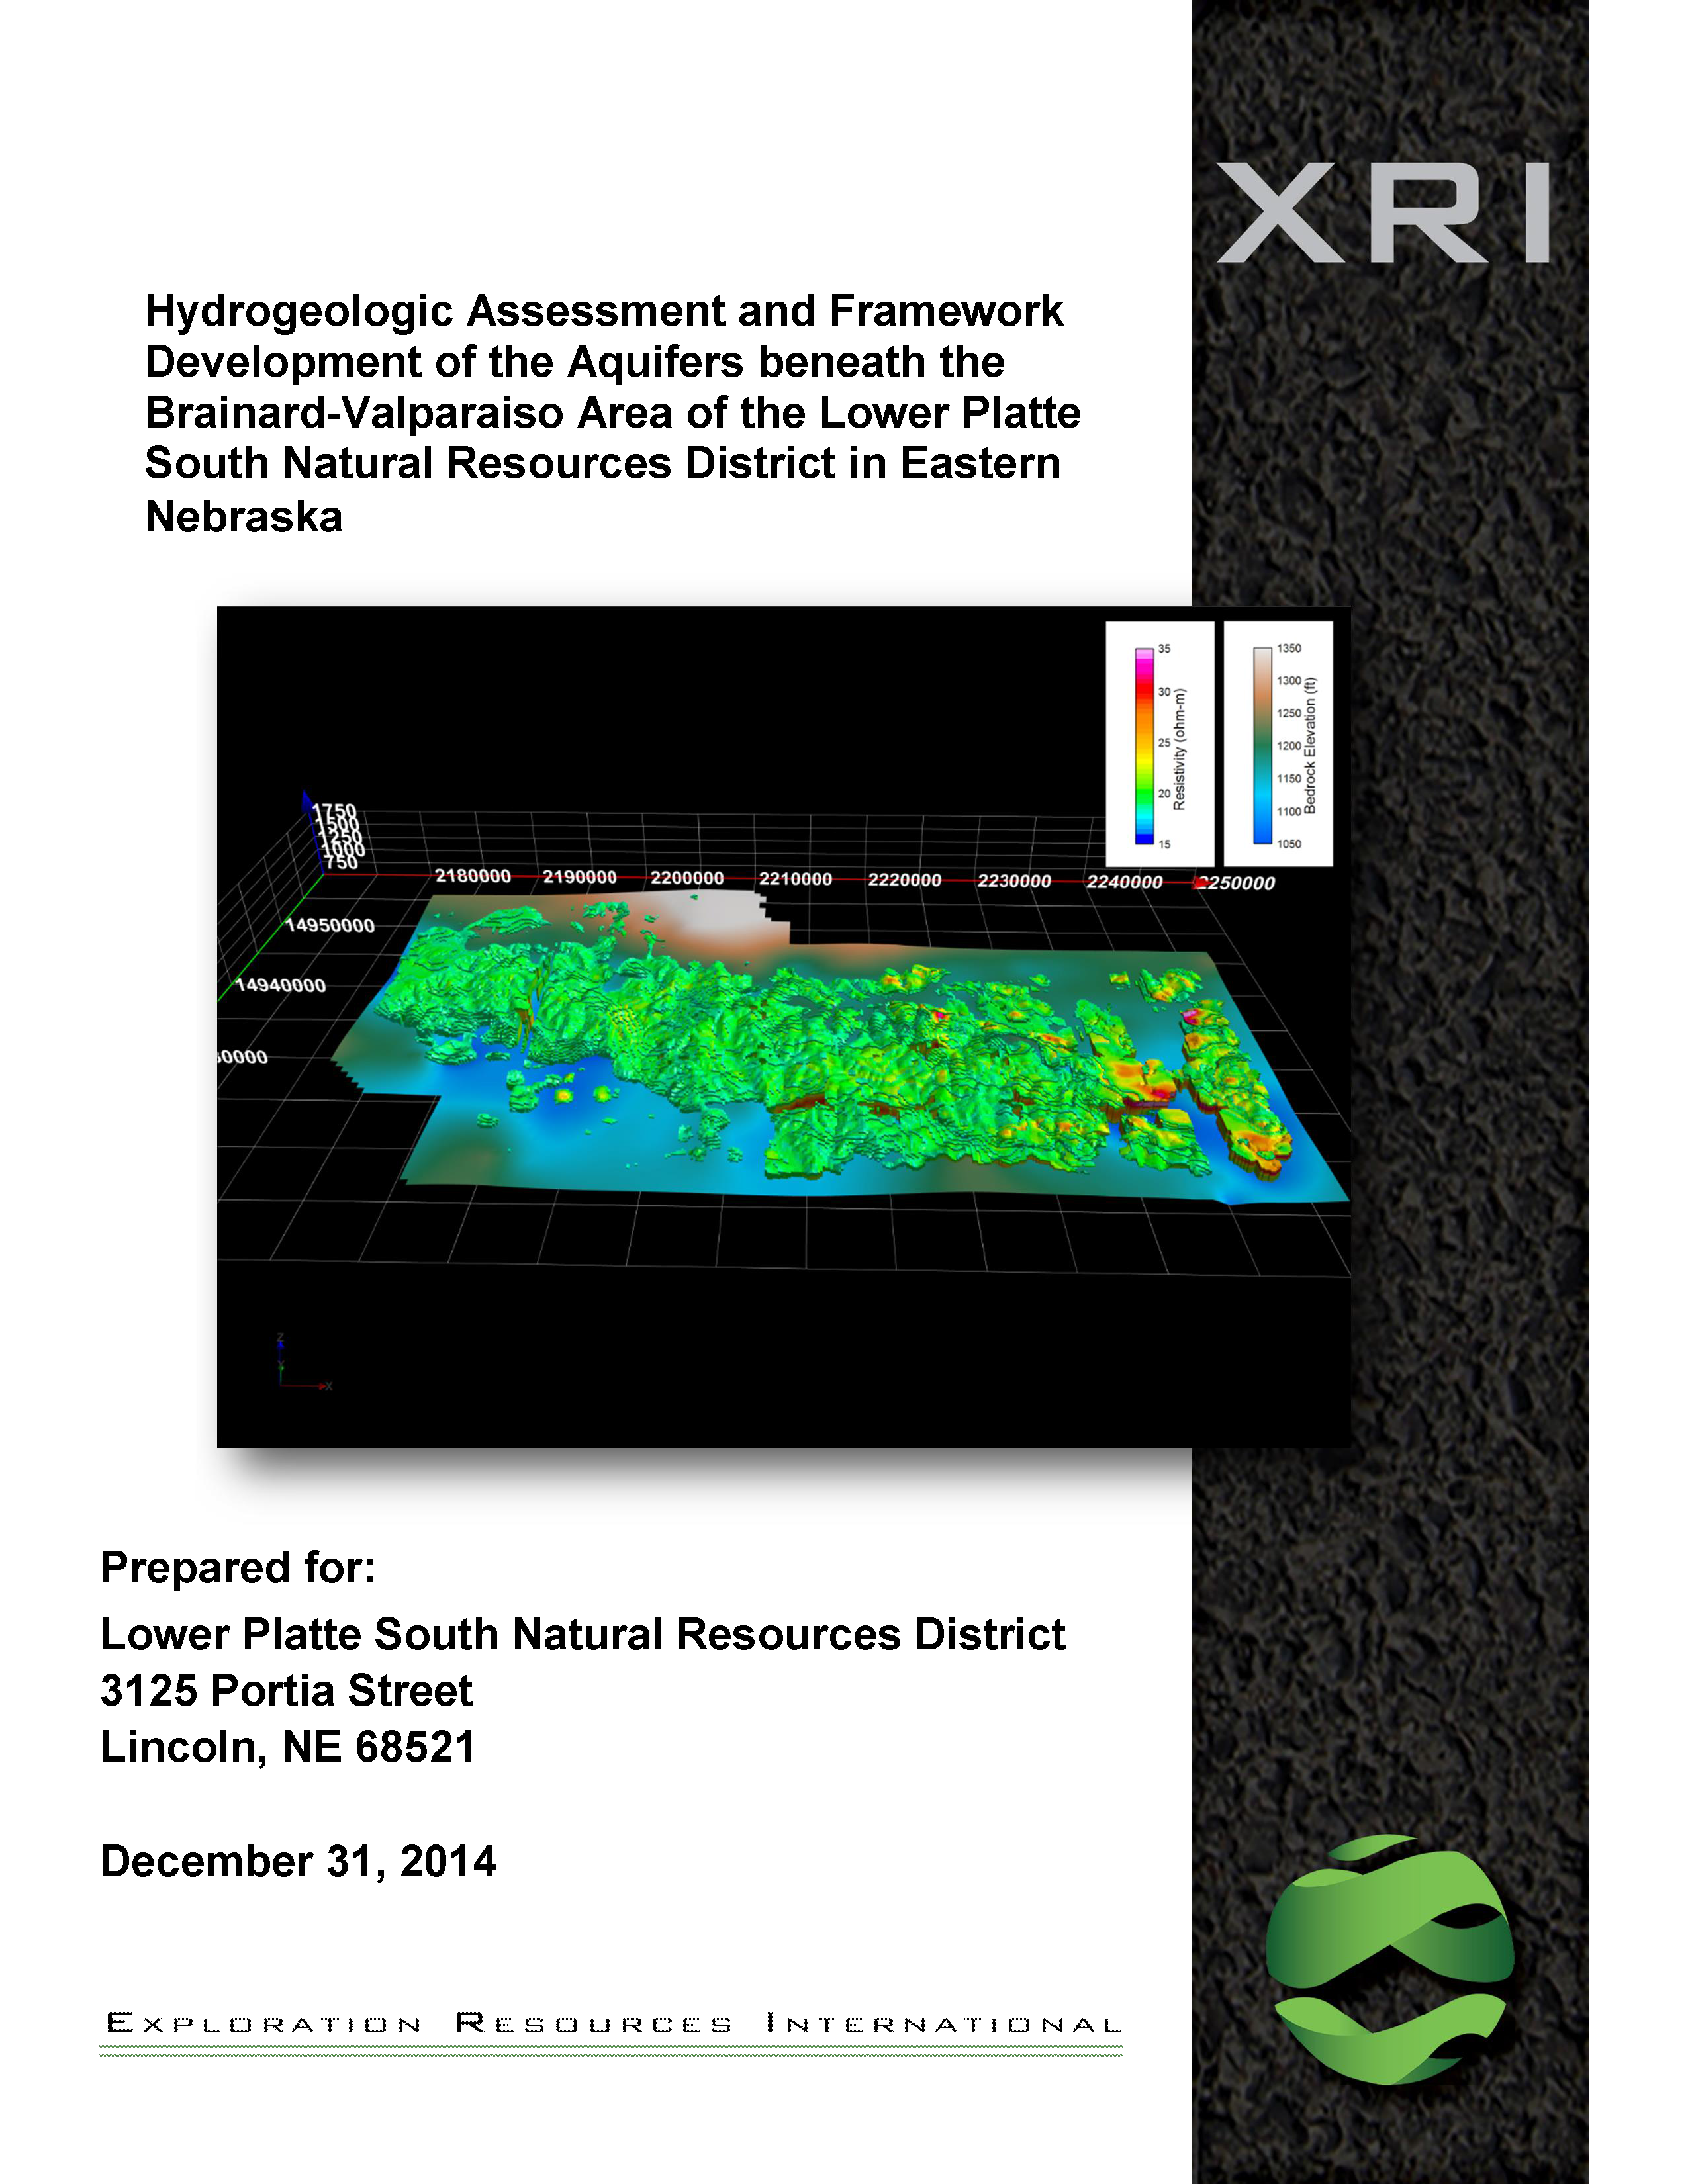
Lower Platte South Report on AEM Survey in the Dwight-Valparaiso-Brainard (DVB) area
Report on AEM flights conducted for the DVB area that experienced groundwater declines during 2012. XRI conducted the hydrogeologic study in August 2013.
DVB Report ![]() Download text (PDF, 3.6 MB)
Download text (PDF, 3.6 MB)
![]() Download Appendix 1-6 (PDF, 8.2 MB)
Download Appendix 1-6 (PDF, 8.2 MB)
![]() Download Appendix 7A (PDF, 9.8 MB)
Download Appendix 7A (PDF, 9.8 MB)
![]() Download Appendix 7B (PDF, 9.2 MB)
Download Appendix 7B (PDF, 9.2 MB)
![]() Download Appendix 7C (PDF, 4.0 MB)
Download Appendix 7C (PDF, 4.0 MB)
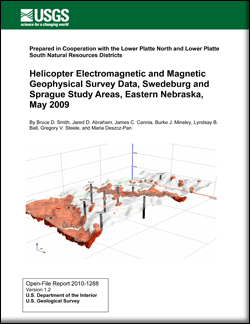
 Swedeburg-area Helicopter Electromagnetic (HEM) Survey Report, 2009
This report contains maps and discussion of the hydrogeology in the Swedeburg, Nebraska area based on interpretation of HEM data collected in 2009.
![]() Download (PDF, 13.6 MB)
Download (PDF, 13.6 MB)
This report contains data gathered from HEM surveys flown in the Sprague and Swedeburg areas in the spring of 2009.
![]() Download (PDF, 4 MB)
Download (PDF, 4 MB)
 Sprague-area Helicopter Electromagnetic (HEM) Survey Report, 2009
This report contains maps and discussion of the hydrogeology in the Sprague, Nebraska area based on interpretation of HEM data collected in 2009.
![]() Download (PDF, 4.7 MB)
Download (PDF, 4.7 MB)
Google Earth AEM Data Files (See 2014 2015 and other newer AEM tabs for more recent data)
Lower Platte South Google Earth Deliverable for Sprague area
The results presented in the Sprague-area Helicopter Electromagnetic (HEM) Survey Report, 2009 have been converted into Google Earth format for the Sprague, Nebraska area based on interpretation of HEM data collected in 2009. Click here for a link to download the data (you can select "no thanks" to the pop-up and still download the
files).
The airborne survey results from ENWRA's 2007 Oakland, Ashland and Firth Pilot Study Sites (multiple reports listed above) have been converted into Google Earth format based on interpretation of HEM data collected in 2007. Click here for a link to download the data (you can select "no thanks" to the pop-up and still download the files).
Pilot Site Groundwater Water Level, Weather and Sampling Data
Dropbox Links to obtain data:
Click here to access ENWRA's Ashland, Oakland and Firth groundwater data folders. Dropbox is free for users but when downloading data, please save to your computer hard drive (choose direct download) so as to not fill up space on your personal dropbox account (300 MB).
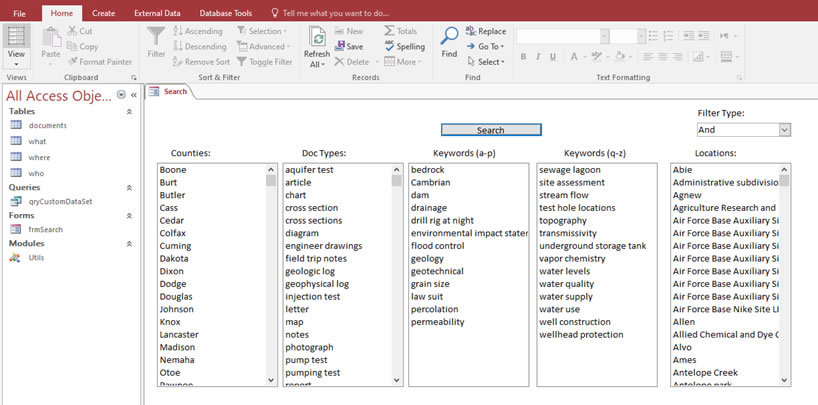
ENWRA Archive
Click here to access ENWRA's Archive data folders prepared by Dana Divine of the Conservation and Survey Division (CSD) of the School of Natural Resources at Univerity of Nebraska-Lincoln in 2011 (includes some additional archived sources gathered to-date). Dropbox is free for users but when downloading data, please save to your computer hard drive (choose direct download) so as to not fill up space on your personal dropbox account (Warning files total 5.7 GB). It is recommended you download the access database and then return to the Dropbox for copies of the PDF files associated with your search. You can select "no thanks" to the sign-up for a Dropbox account and still download the files (Dropbox no longer works in Internet Explorer browser).
Secondary Bedrock Aquifer Sampling and Age-Dating Project (Water Sustainibility Fund #4125)
The following USGS online publication was approved for release and has been made available to the public: USGS Scientific Investigations Report 2021–5055 Suggested citation: Hobza, C.M., and Flynn, A.T., 2021, Groundwater quality and age of secondary bedrock aquifers in the glaciated portion of eastern Nebraska, 2016–18: U.S. Geological Survey Scientific Investigations Report 2021–5055, 42 p. This publication is available online only (https://doi.org/10.3133/sir20215055).
Click here for a link to a presentation of the results from December 9, 2020. An additional talk was presented at the March 2, 2021 NRD Water Programs conference.
ENWRA Meetings and Presentations
2023 Minutes
2023 Technical Committee Meeting Minutes ![]() Download (PDF, 1.6 MB)
Download (PDF, 1.6 MB)
2023 Urban Water Presentation ![]() Download (PDF, 34 MB)
Download (PDF, 34 MB)
Minutes from Previous Years
2022 Minutes ![]() Download (PDF, 133 KB)
Download (PDF, 133 KB)
2021 Minutes ![]() Download (PDF, 890 KB)
Download (PDF, 890 KB)
2020 Minutes ![]() Download (PDF, 110 KB)
Download (PDF, 110 KB)
2019 Minutes ![]() Download (PDF, 2.2 MB)
Download (PDF, 2.2 MB)
2018 Minutes ![]() Download (PDF, 480 KB)
Download (PDF, 480 KB)
2017 Minutes ![]() Download (PDF, 117 KB)
Download (PDF, 117 KB)
2016 Minutes ![]() Download (PDF, 209 KB)
Download (PDF, 209 KB)
2015 Minutes ![]() Download (PDF, 228 KB)
Download (PDF, 228 KB)
2014 Minutes ![]() Download (PDF, 361 KB)
Download (PDF, 361 KB)
Video (click the images to play the videos, see Projects tab for more)
Water Vision - Mapping Eastern Nebraska Aquifers with the Heliborne Electromagnetic Survey
Ashland
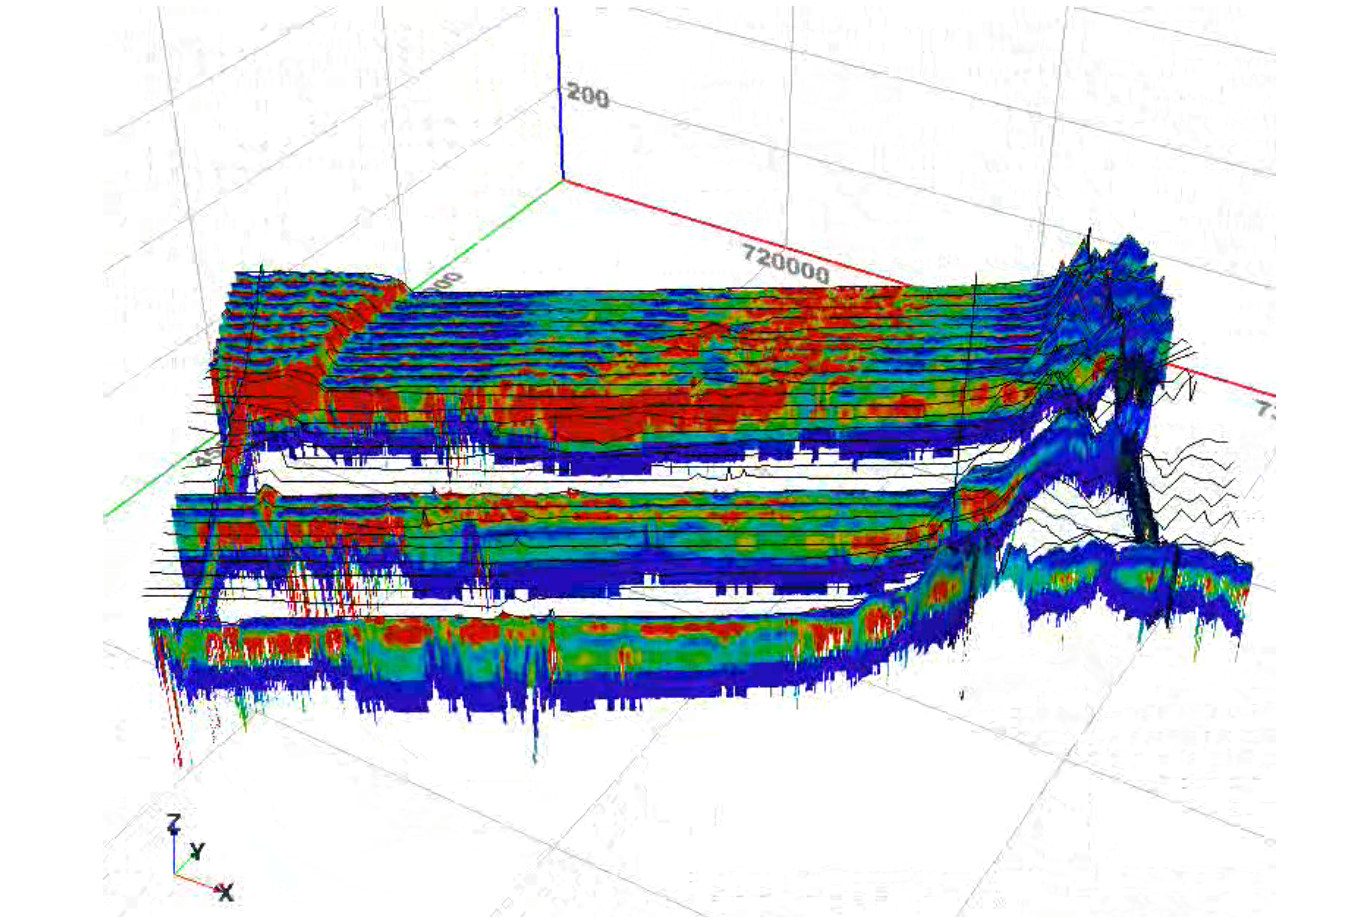
This shows inverted HEM data from the Ashland pilot study site. The white areas are where data has been removed to provide a cross-sectional view. The starting viewpoint is to the north. The Todd Valley is represented by red in the upper left hand corner and the glacial till uplands near Gretna by blue in the upper right hand corner.
Firth
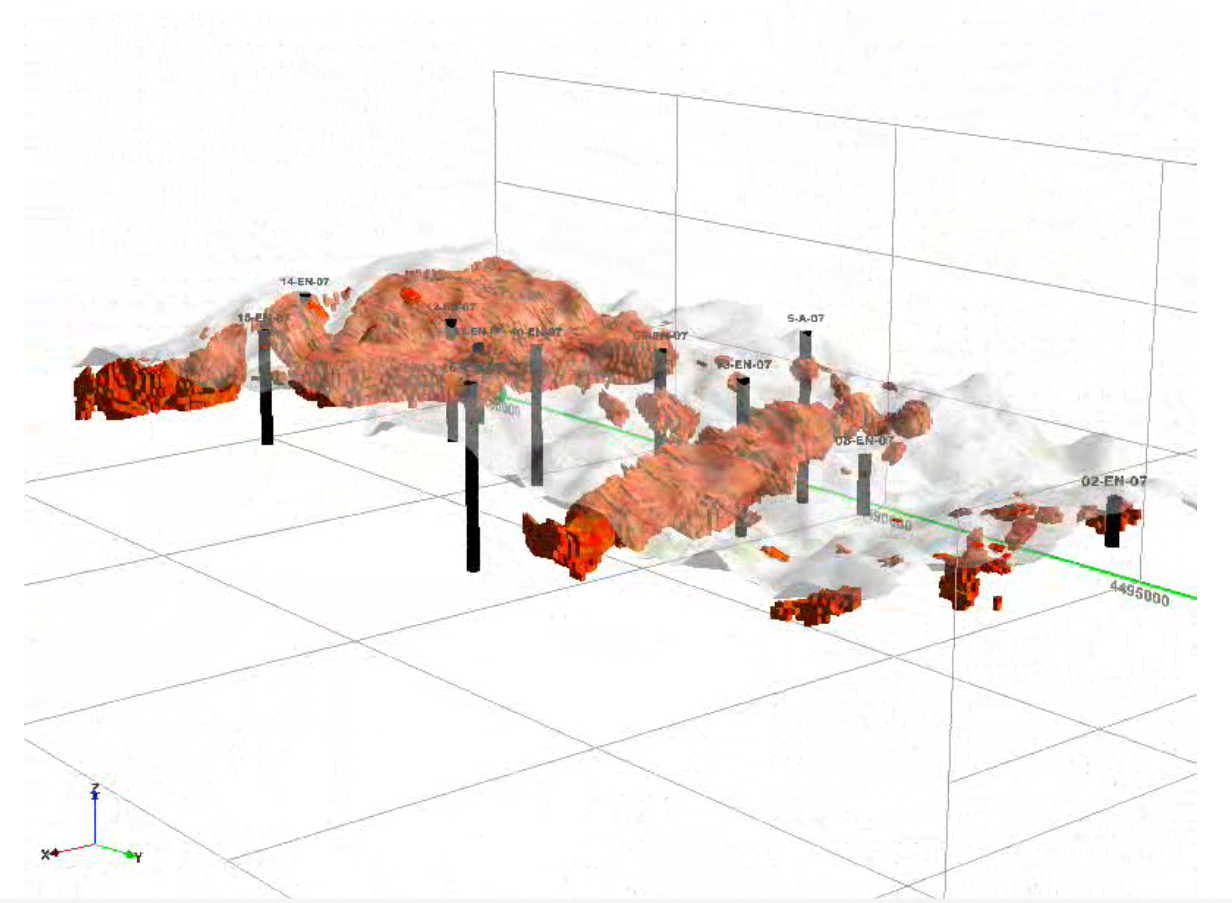
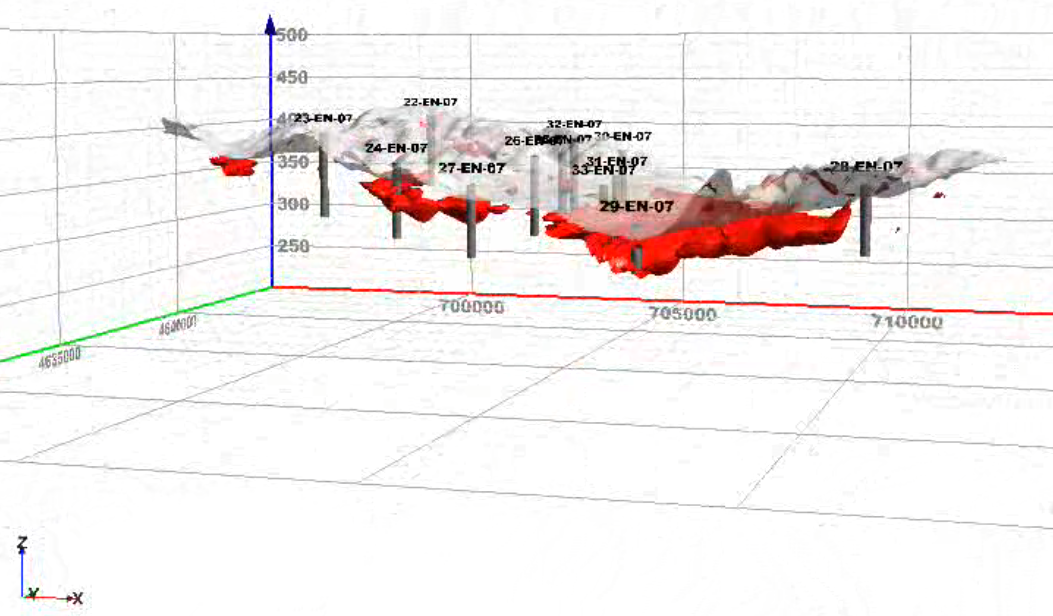
This is the Firth voxel model generated from inverted HEM data. Red zones are areas having resistivity values greater than or equal to 80 ohm-meters. The semi-transparent layer represents ground surface, and the black columns represent test holes. The starting viewpoint is to the northwest. The two red areas likely correspond to the edges of a paleovalley aquifer.
Oakland
This is the Oakland voxel model generated from inverted HEM data. Red zones are areas having resistivity values greater than or equal to 80 ohm-meters. The semi-transparent layer represents ground surface, and the black columns represent test holes. The starting viewpoint is to the north. The red swath coincides with sand and gravels associated with Logan Creek.